 En février, nous avons mené une enquête sur les habitudes d'achat en ligne. Pour remercier les 300 participants, nous publions ici quelques résultats.
L'enquête faisait partie d'une étude sociale basée sur une conception centrée sur l'utilisateur et a été en ligne pendant dix jours. C'est plutôt court mais cela a suffit pour que nous puissions recueillir 290 réponses de 35 pays du monde entier. L'étude visait à comprendre les habitudes des utilisateurs afin de leur offrir la meilleure expérience possible.
Nous aimerions partager quelques graphiques parmi ceux que nous avons tracés afin de mettre en évidence quelques découvertes intéressantes concernant les habitudes d'achat en ligne en ces temps difficiles.
Commençons par une estimation de la représentativité de notre échantillon. Nous avons comparé la répartition par âge des participants à la répartition par âge des internautes du monde entier (statista.com).
Nous avons regroupé les données par génération et avons eu une bonne surprise : les distributions sont vraiment proches (figure 1) ! Cela signifie que nous pouvons être assez confiants sur la représentativité des résultats même si 300 réponses sont loin d'être suffisantes pour faire une généralisation mondiale. Les graphiques suivants ne peuvent pas être utilisés pour une analyse rigoureuse, mais sont des lignes directrices intéressantes pour des études ultérieures.
Rappel sur les générations :
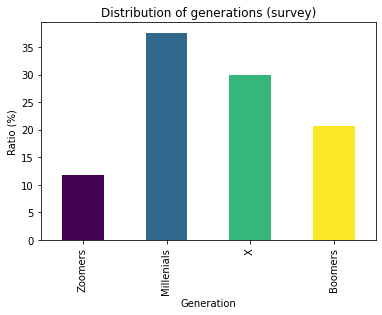
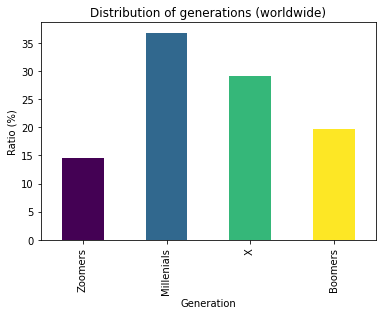
Figure 1: à gauche, la répartition par âge par génération des 290 participants à l'enquête. A droite, la répartition par âge par génération d'internautes dans le monde (source: statista.com). Les zoomeurs sont légèrement sous-représentés dans l'enquête.
Voici la signification des fréquences pour comprendre le tracé de la figure 2 :
La plupart des gens achètent entre une fois par semaine et une fois par mois (~ 75%). C'est un résultat intéressant, qui conduit à l'idée que l'achat en ligne, même pendant le verrouillage, n'est pas aussi fréquent qu'on pourrait le penser. Ces chiffres sont intéressants à garder à l'esprit pour analyser la figure 5 (voir ci-dessous). La figure 3 suggère qu'il existe deux façons différentes d'acheter en ligne: à l'aide d'un ordinateur ou à l'aide d'un smartphone. Les très mauvais résultats des tablettes pourraient signifier que les smartphones sont utilisés dans des contextes spécifiques, lorsque des personnes sont à l'extérieur ou en déplacement mais nous n'en avons pas encore la preuve.
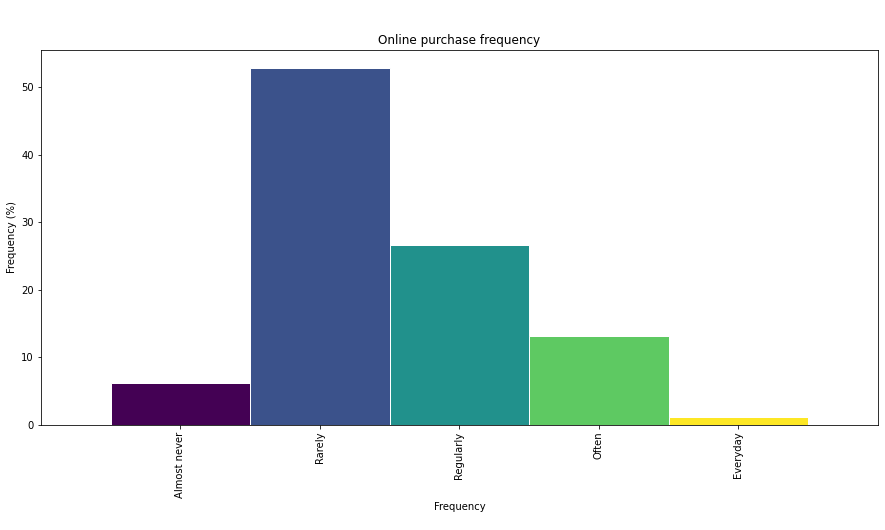
Figure 2: Fréquence d'achat. 75% des participants achètent rarement ou régulièrement, c'est-à-dire une fois par semaine ou quelques fois par mois.
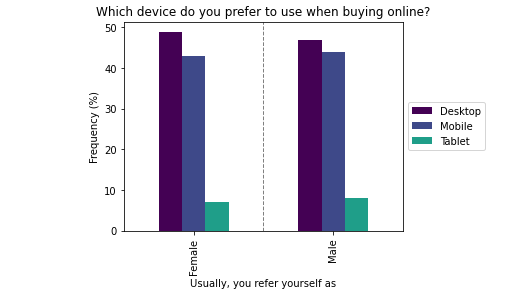
Figure 3: appareil préféré lors de l'achat en ligne. Il n'y a pas de différence significative entre les sexes, la préférence étant équitablement partagée entre Desktop (ordinateur) et Mobile (smartphones).
La figure 4 donne un aperçu intéressant du parcours habituel de l'utilisateur entre le moment du désir d'acheter et la validation de l'achat. Les moteurs de recherche sont les principaux points d'entrée, ce qui confirme leur importance dans les sociétés de consommation actuelles.D'autre part, plus de 30% des participants recherchent un produit suite à un conseil sur les réseaux sociaux ou un ami, suggérant que les relations sociales sont également un moteur important pour décision d'achat.
Néanmoins, la plupart des gens finissent par acheter sur des marchés ou sur des sites Web de marques connues, qui sont généralement d'énormes plates-formes. Cela suggère également que la plupart des gens font attention lorsqu'ils achètent en ligne, en évitant les sites Web non fiables ou les petits vendeurs.
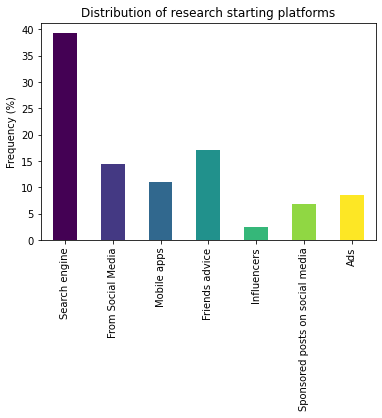
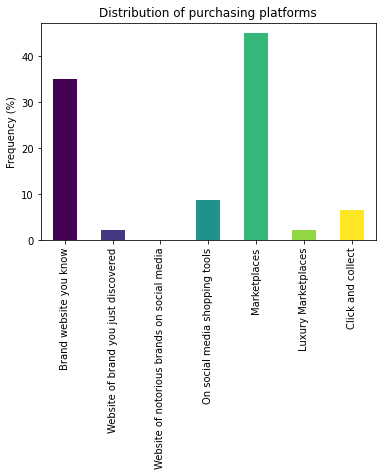
Figure 4: À gauche, la répartition des stratégies de recherche, c'est ainsi que les participants commencent généralement à chercher ce qu'ils vont acheter en ligne. Le moteur de recherche est de loin la réponse la plus courante mais il est intéressant de noter que les conseils d'amis (qui ne sont pas forcément numériques) atteignent un bon score. A droite, la distribution de la plateforme d'achat. Les marchés et les sites Web de marques que vous connaissez recueillent 80% des réponses, ce qui suggère que les grandes plates-formes sont préférées.
La dernière série de graphiques (figure 5) est vraiment intéressante et mériterait une étude plus détaillée. Notre analyse de ces quatre parcelles est que les gens pourraient se sentir plus engagés qu'ils ne le sont vraiment. En effet, environ 2/3 des participants diraient que la pandémie a eu une influence sur leurs habitudes d'achat en ligne mais seulement 1/2 d'entre eux ont déjà acheté quelque chose d'utile pour les autres.
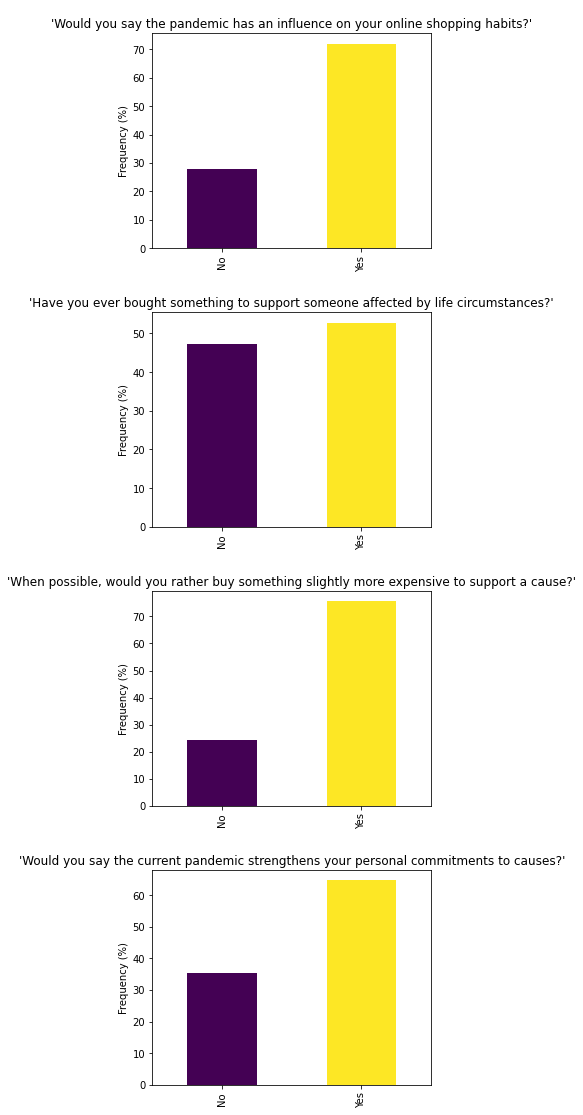 Figure 5 (de haut en bas): premier graphique, l'effet de la pandémie sur les habitudes des participants. 7 personnes sur 10 affirment que la pandémie et ses conséquences ont influencé leurs habitudes d'achat en ligne. Deuxième graphique, le ratio de participants qui ont au moins une fois acheté quelque chose pour aider quelqu'un dans le besoin est d'environ 50%. Troisième graphique, le ratio de participants prêts à acheter quelque chose d'un peu plus cher pour soutenir une cause est d'environ 75%. Dernière graphique, environ 60% des participants affirment que la pandémie a renforcé leurs engagements personnels.
Lien : pandas, la librairie python utilisée pour tracer les graphiques